Introduction to quantitative methods with
Introductory session
Introductory Chapter
Note
- Exercises associated with this chapter here

About us
- 2 french instructors 🇫🇷
- colleagues from INSEE: National Institute of Statistics and Economic Studies
![]()

All about us
Instructors
Nathan Randriamanana
All about us
Instructors
Clara is coming tomorrow! 🔒 🤩 🥳
About my job
- I wear two hats:
- 🎩 Application Administrator: Acting as the functional lead for the SIRENE register. I bridge the gap between business needs and IT by writing functional specifications for system maintenance and evolution.
- 🧢 Data Scientist: Managing the end-to-end ML workflow for APE classification from model training and delivery to its integration into the production application.
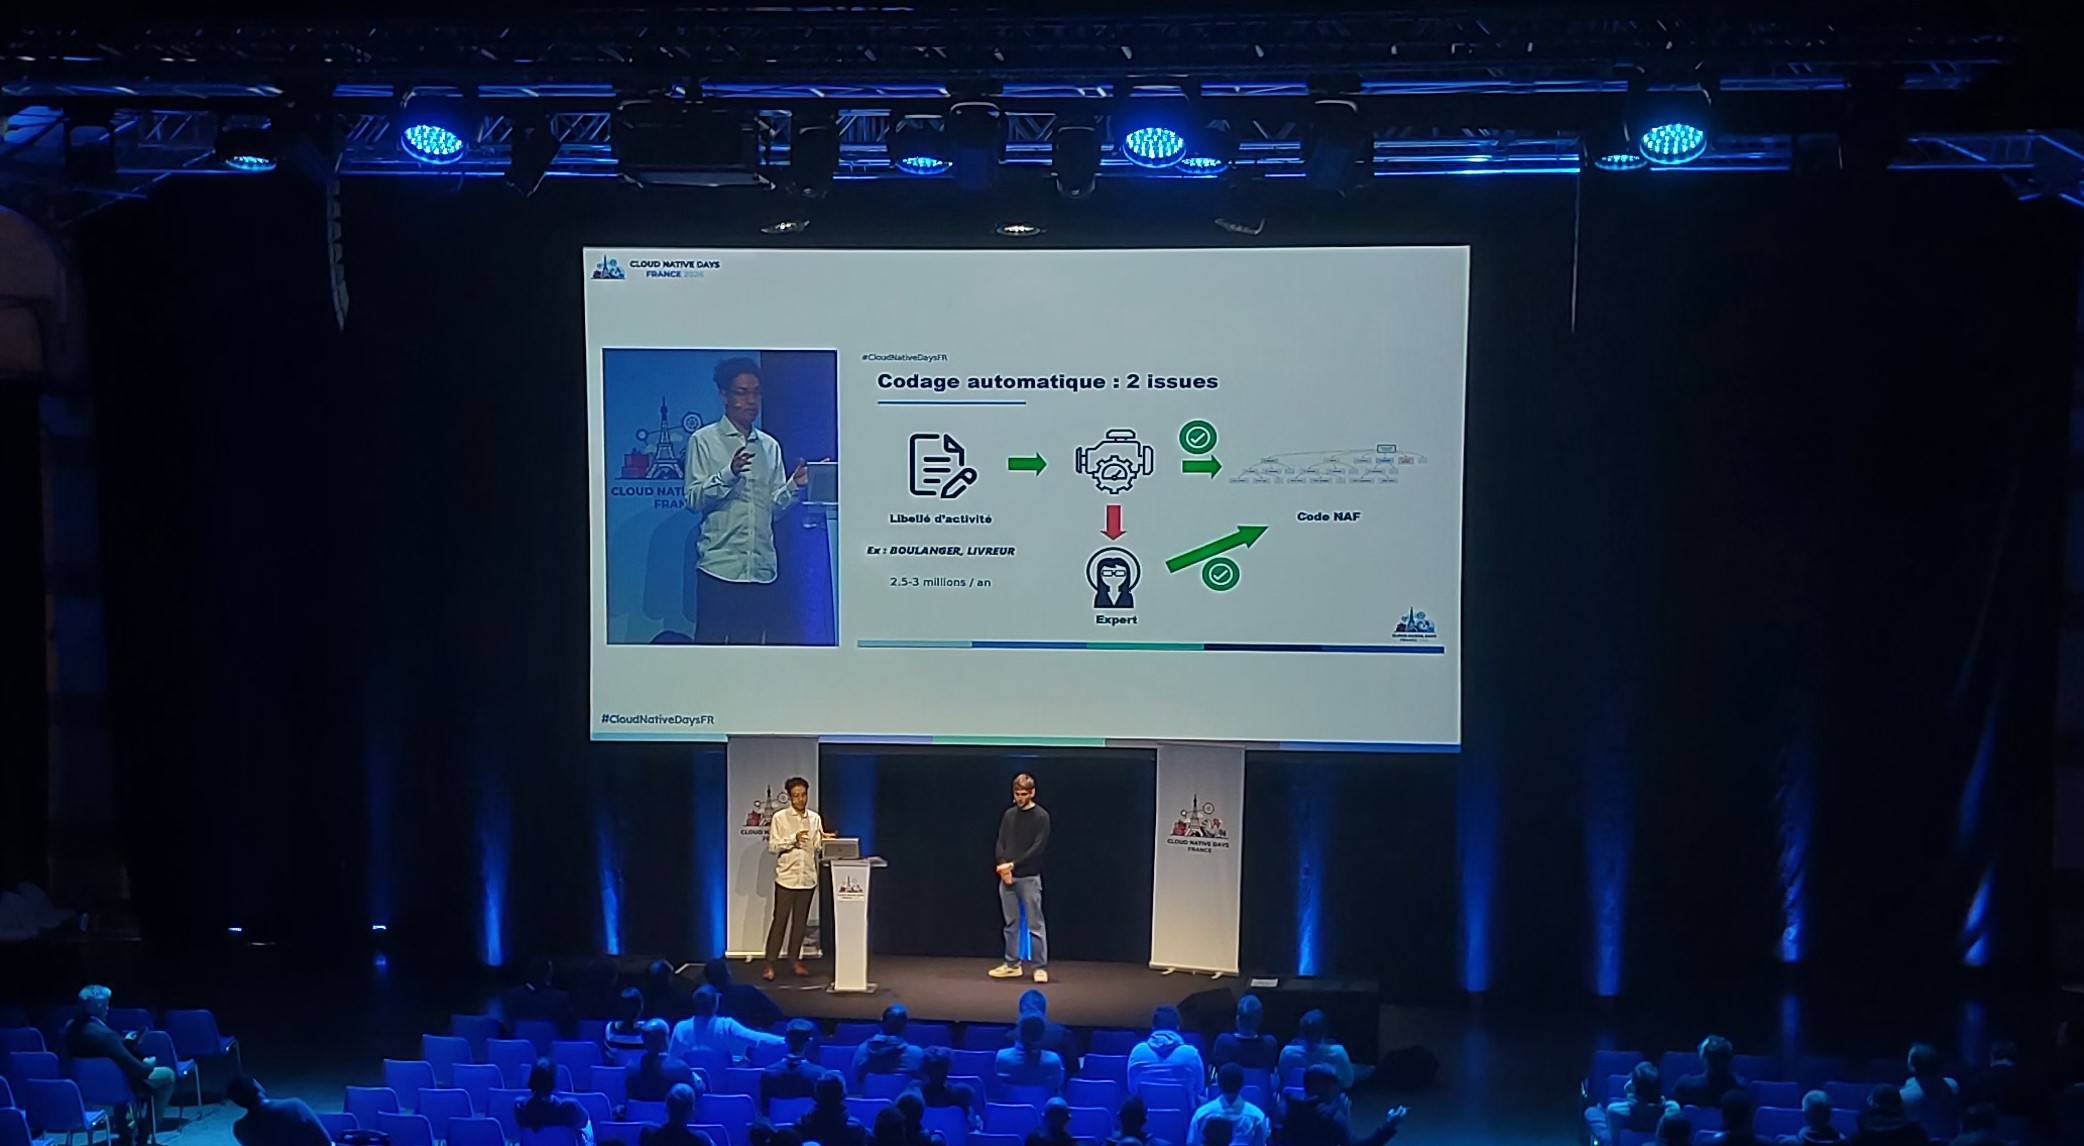
Example from presentation at the Cloud Native Days France 2026 conference regarding cloud technologies
Data diversification (1/4)
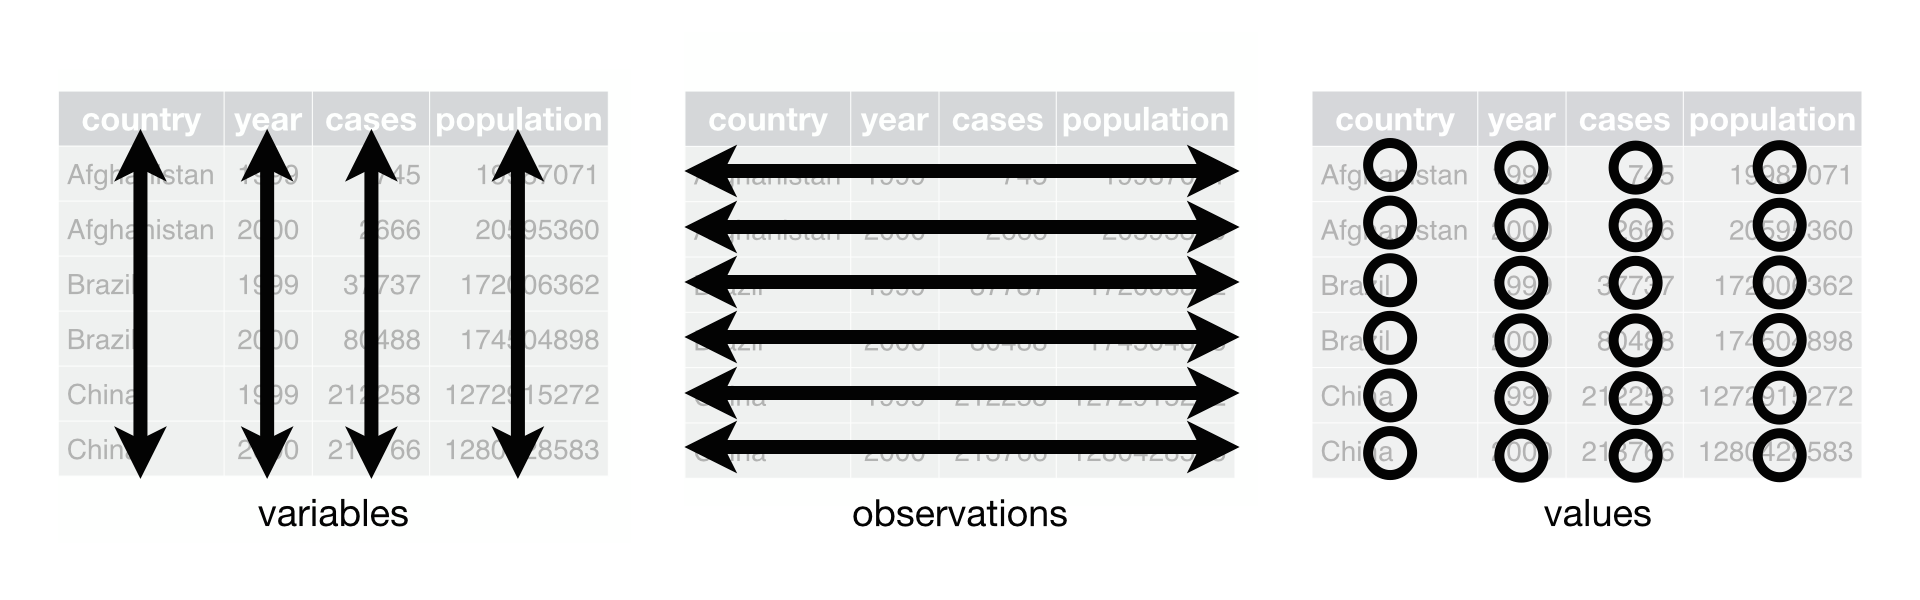
Classic tabular data
- Structured data in table format (rows and columns).
![Source: Hadley Wickham, R for data science]()
- is exceptionally well-equipped for this (handled via dataframes).
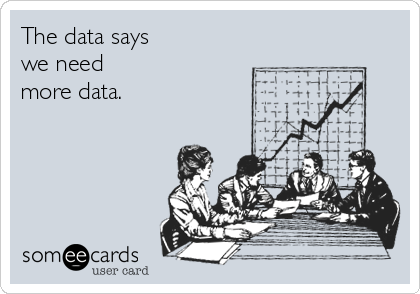
Data is everywhere
GitHub : Where the code lives
- Collaborative platform: A global hub for sharing and hosting code.
- Much more than just code:
- Project documentation and tutorials;
- Professional websites and dashboards (like the ones we can build with R).
- The home of Open Source and Reproducible Research:
- Where NSIs (like Insee, Stats NZ, or UK ONS) share their methodology;
- Allows for transparent and verifiable statistical production.

The principle of an open source language
RA “swiss army knife” software
You can do everything in R:
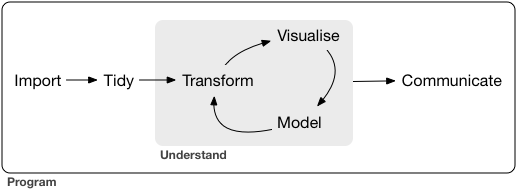
Excerpt from R for data science (the bible)
The RStudio Interface
The four main panes of RStudio
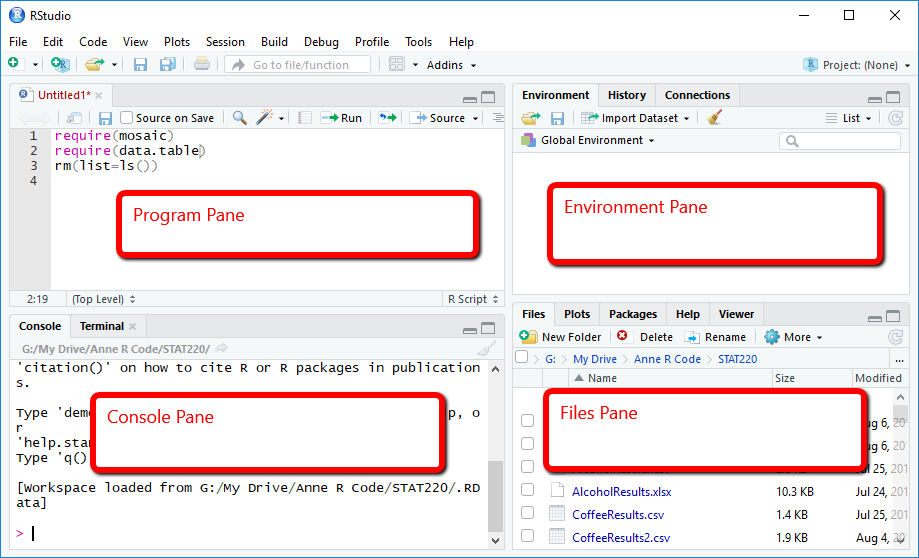
The RStudio Interface
The four main panes of RStudio
- Source (Top Left): Your script editor. This is where you write and save your code.
- Console (Bottom Left): Where the code actually runs. You can type commands here for quick tests.
- Environment (Top Right): Shows your active data, variables, and history.
- Output Panes (Bottom Right): Where you see your plots, files, and help pages.
Getting started with SSP Cloud

What is the SSP Cloud?

Launching an RStudio service
Quick Guide

Click on Service Catalog on the left menu
Launching an RStudio service
Quick Guide

Keep the default RStudio settings and launch
Launching an RStudio service
Quick Guide
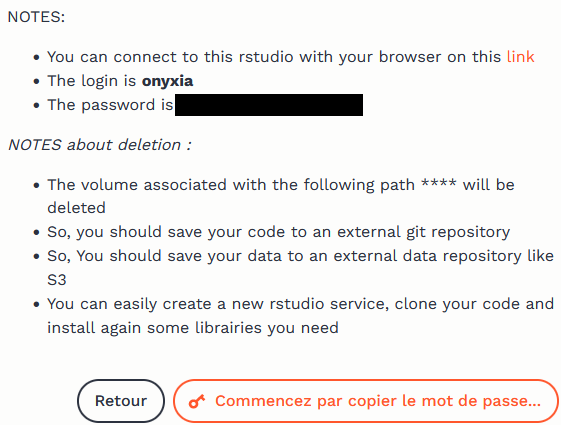
Retrieve your RStudio service password
Launching an RStudio service
Quick Guide

Alternative way to find your service password
Launching an RStudio service
Quick Guide
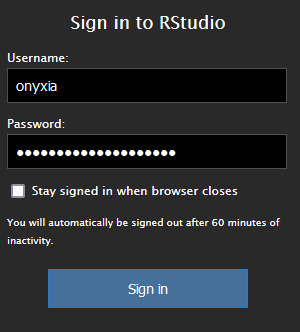
Log in to your service
We want YOU to lead the innovation

- Create your space: Don’t just code alone. Start a Slack channel, a Teams group, or an internal forum to help each other.
- Onyxia is a helper, not a cage: It is a facilitator based on open standards. Your code remains yours and stays portable.
- Continuous Exchange: For those inspired to lead or teach others, we will offer one day of remote follow-up to exchange ideas, troubleshoot together, and help you kickstart your internal community.
Take the lead
The best way to learn is to teach others. Build your BoS community today and we will help you become the next generation of instructors.
Socials
I may not post every day, but I’d love to stay in touch!
LinkedIn
GitHub