Reproducible report generation with and Quarto
Check out the slides below or click here to view the slides in full screen.
One of the major challenges in research and data analysis is the transparent and reproducible communication of results, as well as collaboration. Reproducible publications offer a solution to this challenge by integrating code, data, and analyses into a format that allows anyone to understand the data processing steps that were implemented and to reproduce the exact results, provided they have the same environment.
Quarto, the tool that succeeded to R Markdown, makes it possible to produce text documents while natively integrating chunks of R code. This helps streamline the writing process of a publication by greatly reducing the number of manual steps required to include graphics or code in a document: rather than having Stata code that generates Excel/Calc outputs which are then integrated into a Word document or transformed into LaTeX tables, we rely on a single source document that contains both the text and the code that produces the outputs of the final document.
With Quarto, we are able to separate content from presentation. This allows us to focus on the most important aspects: the substance of the analysis.
An example of such a formatted report is available on this page.
This practical session is less guided than usual in order to give you more freedom to explore and produce a document.
0.1 Initializing the document
- Click on
File > New file > Quarto document:- Provide a title and an author for the report
- Choose
HTMLas the output format - Uncheck the
Use visual markdown editoroption
- Save the file under the name
report.qmd. - In the file header, modify the publication metadata (title, author, date, etc.) using some of the options from this page.
- Write a first sentence in the body of the document using one or two elements of
Markdownsyntax for formatting. For example, make part of the text bold. - Add a level-2 heading (two
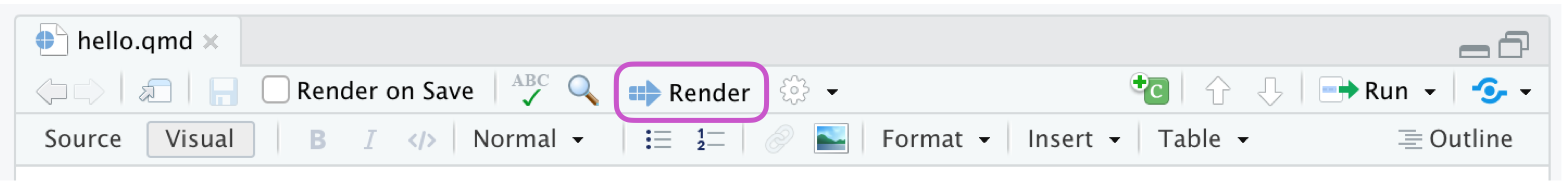
#) to create anAboutsection and write one or two sentences in it. - Render the document by clicking on the
Renderbutton:
PositR outputs
Choose one of the chapters we previously worked on for which we produced a graph or a map. Reuse the example code from the solution (data import and visualizations) and insert it into the document.
Compile the document. If there are errors, read them carefully and fix them in order to obtain a reproducible document.
Use the
GTpackage to create a nice table, for example a descriptive statistics table (a mean, for instance).
Customize the output to obtain an aesthetically pleasing document. To do so, you may use a template.
On a Mac , some useful characters are more difficult to type. For example, | can be obtained using the following shortcut: Shift + Option + L
1 Resources
Some examples here
2 Corrections
You can find all corrections here.